Content Status
Type
Linked Node
Semiquantitative Results Interpretation in CBNAAT
Learning ObjectivesLearn about Semiquantitative Results Interpretation in CBNAAT Module.
The Cartridge-based Nucleic Acid Amplification Test (CBNAAT) software generates the results from the measured fluorescence signals and embedded calculation algorithms. In addition to qualitative results, the software provides semi-quantitative results, which provide information about the bacterial load in the specimens tested.
Semi-quantitative result interpretation is based on Cycle threshold (Ct) values of Mycobacterium tuberculosis(MTB) specific targets (Figure 1).
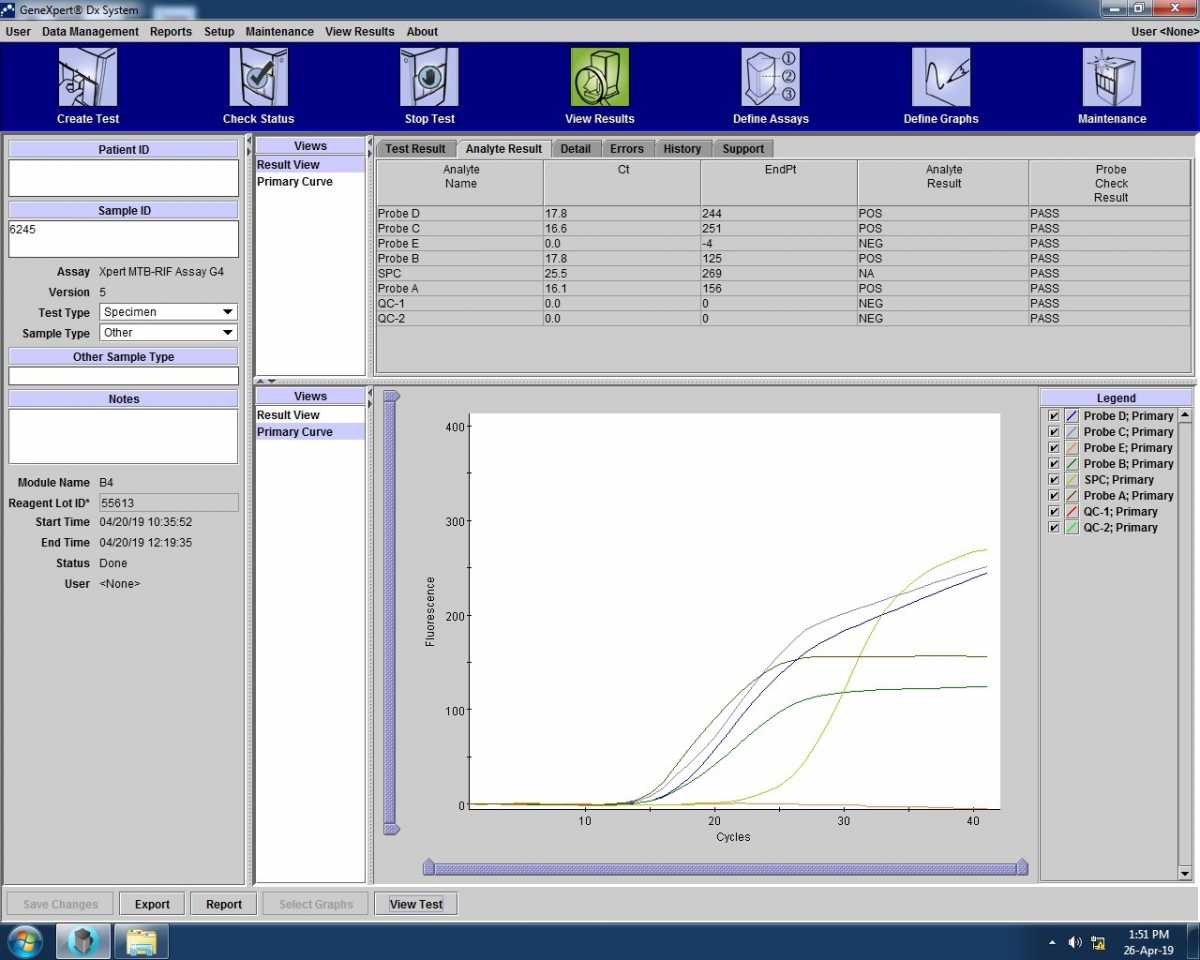
Figure 1: Ct values from CBNAAT results can be seen in the second column
What is a Ct Value?
To understand Ct value, let's understand more about Polymerase Chain Reaction (PCR) cycles and threshold line.
Figure 2 shows a graph that shows the increase in fluorescence intensity as the PCR progresses.
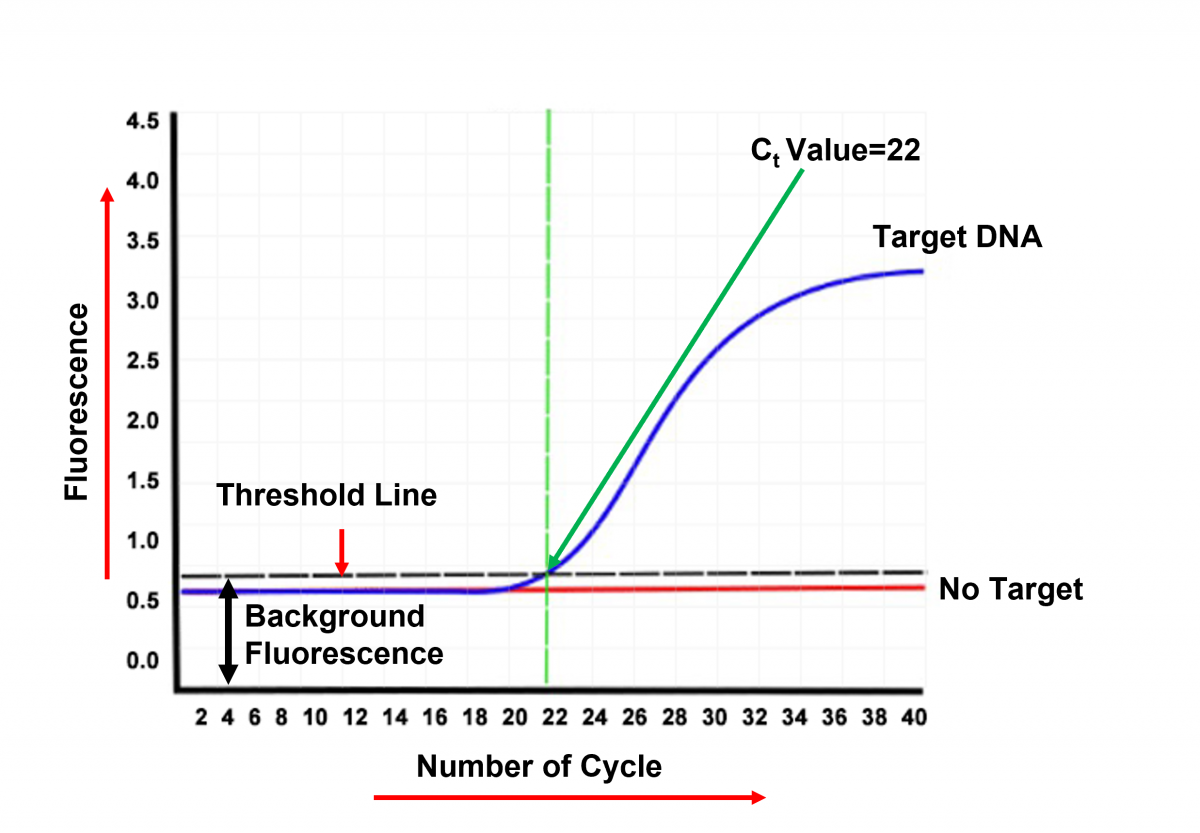
Figure 2: Signal detection and quantitation
- At a low cycle number, the fluorescence emitted is weak and represents background noise.
- Once the increase in fluorescence is linear, a line can be used to divide the background level, from the specific signal. This is called the threshold line. The threshold line represents the level of detection or the point at which a reaction reaches a fluorescent intensity above background levels.
- The PCR cycle number, in which the amplification curve crosses the threshold line, is called cycle threshold (CT).
- The presence of target DNA in PCR reaction will lead to a detectable Ct value.
- The absence of target DNA will not lead to an increase in fluorescence, hence no Ct value.
MTB Not Detected
CBNAAT will declare a test as MTB detected when at least two MTB specific probes exhibit Ct values in a predefined Ct range established by the software. In the test shown in Figure 3, Ct values for all the probes are zero, therefore the result is declared as in Figure 4.
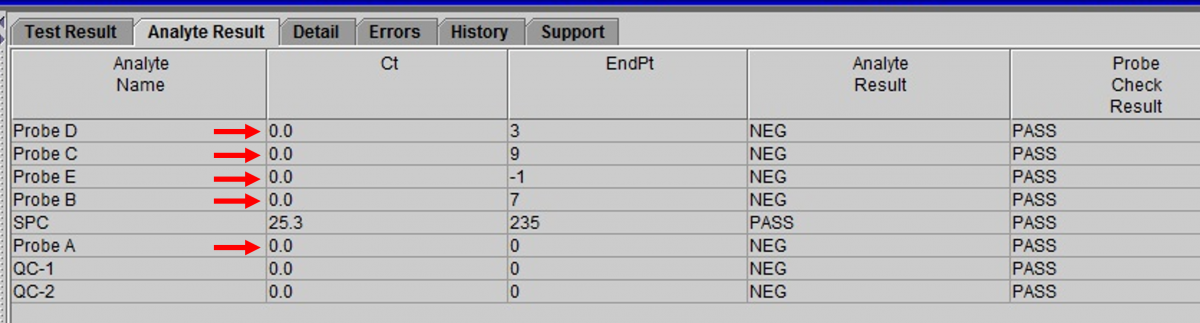
Figure 3: Ct values for all the probe values are zero
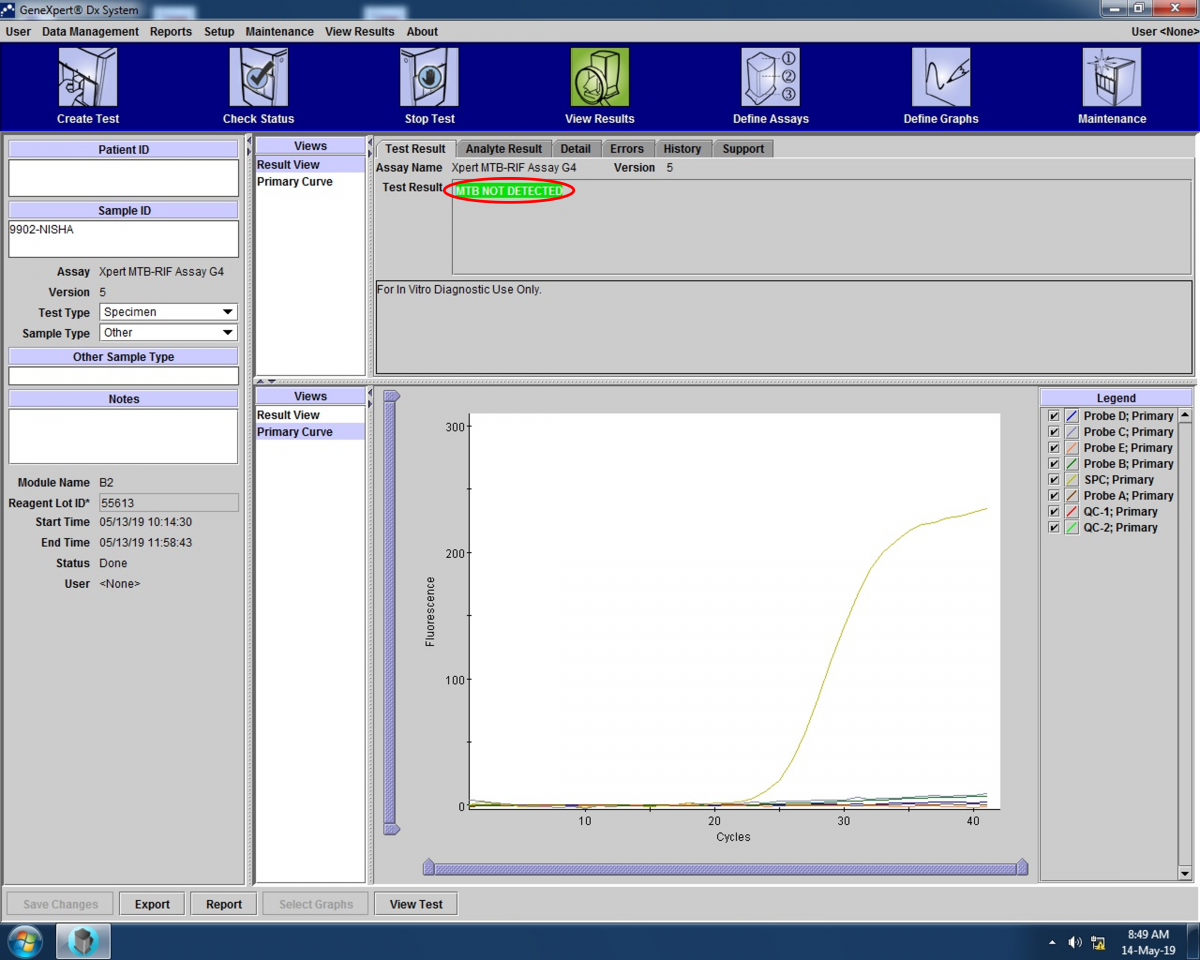
Figure 4: Result shown as MTB not detected since Ct values for all the probe values are zero
Load Base Analysis Based on Ct Values
- The MTB detection results are also displayed in a semiquantitative manner, as MTB detected High, Medium, Low, and Very Low by the CBNAAT software (Figure 5).
- This quantitation is made on the basis of the mean Ct value of all the MTB specific probes present in the sample.
- An early Ct value of less than 16, will indicate that the specimen has a higher number of target molecules, therefore the result is displayed as MTB high.
- A mean Ct value ranging from 16 to 22, is declared as MTB detected medium.
- Ct value of 22 to 28 will be declared as MTB detected low.
- A mean Ct value greater than 28, will lead to the result, MTB detected very low.
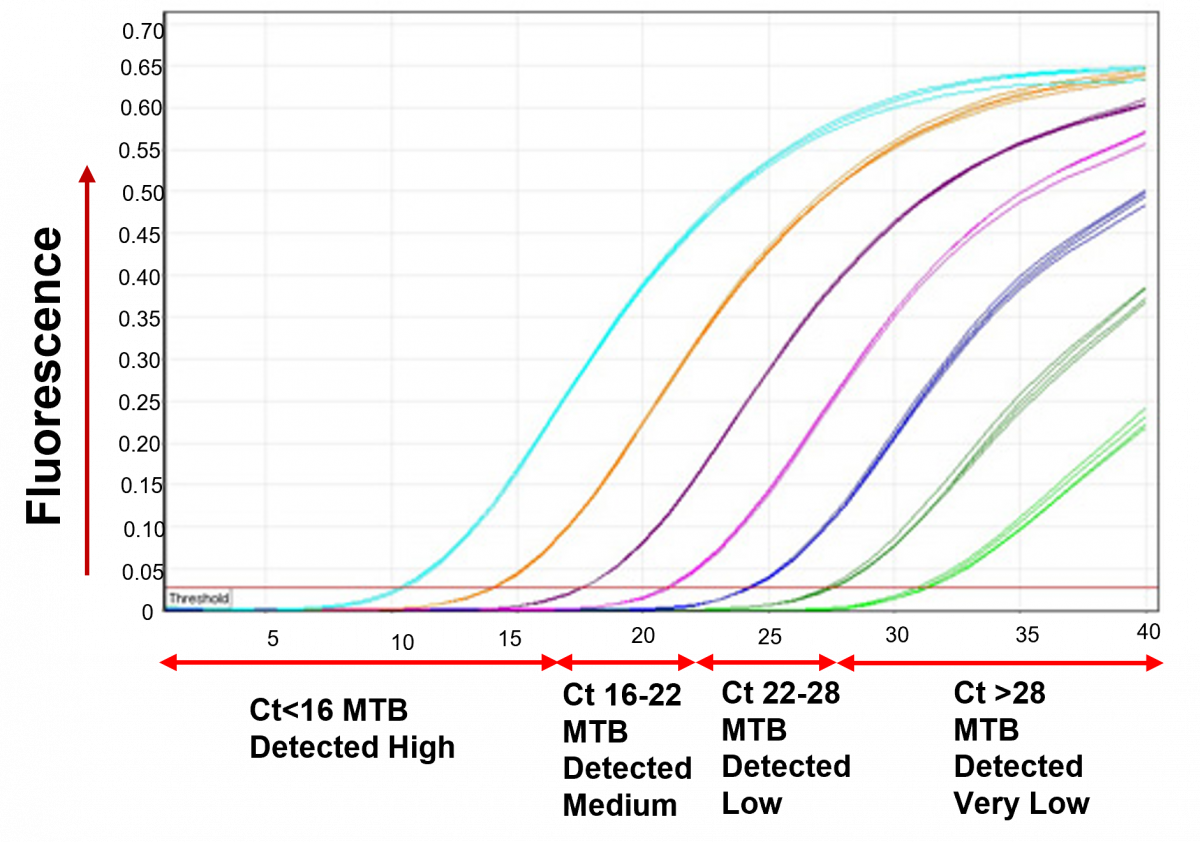
Figure 5: Load base analysis based on Ct values
Resources
- World Health Organization Manual on Xpert MTB/RIF Implementation, 2014.
- Laboratory Diagnosis of TB by Sputum Microscopy – Handbook, GLI Initiative.
Kindly provide your valuable feedback on the page to the link provided HERE
Content Creator
Reviewer
- Log in to post comments